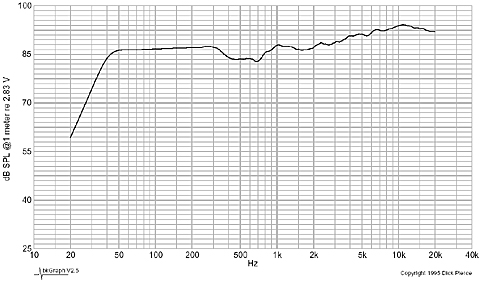
BKGRAPH is a graphing program, nothing more. It
accepts data in a relatively free format, one that is easy
for humans to create, edit and read, and
one which seems to enjoy a degree of de facto
standardization. It reads these data files, along with some
instructions in the form of setup files or command line
options, massages the data, then produces a "graph"
of this data in accordance with some universally accepted
rules about graphing audio data. It sends this graph output
in a universal intermediate form on to "filters"
which convert the data to a form which can control a display
or printing device so you can see the results.
So much for what BKGRAPH does, or is, what doesn't it do? Well, it does not generate the data it graphs, that's the job of some other simulation, measurement or design program. It might even be your job, sitting down entering numbers with some text editor. It does not do bar graphs, pie charts, 3-D plots of population data, or anything like that. It is not a fancy, menu controlled mouse-driven whiz-bang utility for generating pretty picture.
It is really a utility that is an adjunct to other software or hardware that you may already have. It's an accessory program to these other systems.
As such, we have not tried to make it the end-all and be-all program for generating pretty pictures (although it does generate quite nice and professional looking audio graphs, as you'll see). The "user interface" may not be the "friendliest" you've ever encountered. Our intention in designing BKGRAPH is to make it more of a silent (or at least a not very loud) partner to other programs.